Article Text

Abstract
Background Real-world data (RWD) from the Society for Vascular Surgery Vascular Quality Initiative (VQI) registry has been used to support US Food and Drug Administration (FDA) regulatory decisions regarding vascular devices. The variables of cost and time needed for these registry-based studies have not been previously compared to traditional, independent, industry studies that would otherwise have been conducted to support regulatory decisions.
Objectives To determine the potential value (cost and time saving and return on investment) created by device evaluation studies using the VQI registry infrastructure.
Methods We compared studies that used data from the VQI registry with estimated costs of independent industry studies (counterfactual studies) using an established model using design specifications determined by FDA reviewers.
Results We analyzed the initial six studies evaluating vascular devices for regulatory decisions using data from the VQI registry that generated evidence for four device manufacturers. Return on investment for these studies was estimated to be 143% and cost saving as 59% based on an actual per patient (with 5-year follow-up) cost of US$11K using VQI data versus US$26K from the counterfactual when averaged across all studies. Significant enrollment time savings (45%–71%) were also realized compared with industry-based estimates.
Conclusions The use of RWD from the VQI registry in this study and the transcatheter valve treatment coordinated registry network in a prior study indicates that substantial value was added to device evaluation projects by the reuse of registry data, with additional potential savings if linked claims data can be used instead of costly long-term in-person follow-up.
- vascular devices
- device evaluation
- real world evidence
- healthcare costs
This is an open access article distributed in accordance with the Creative Commons Attribution Non Commercial (CC BY-NC 4.0) license, which permits others to distribute, remix, adapt, build upon this work non-commercially, and license their derivative works on different terms, provided the original work is properly cited, appropriate credit is given, any changes made indicated, and the use is non-commercial. See: http://creativecommons.org/licenses/by-nc/4.0/.
Statistics from Altmetric.com
Key messages
What is already known about this subject?
Medical device evaluation is critical for good outcomes but is costly, such that supplemental evaluations after initial device approval are seldom conducted to refine indications.
What are the new findings?
Post-approval device evaluation using real-world data from registries can be done much more economically and faster than traditional independent industry studies.
How might these results affect future research or surgical practice?
More efficient, total product life cycle device evaluation is much more feasible by using real-world data from coordinated registry networks, which should allow better device selection for specific patients, with resulting better outcomes.
Introduction
Access to reliable and meaningful evidence about the safety and effectiveness of medical devices is essential to inform care and improve patient outcomes—a goal shared by all stakeholders in the medical device ecosystem, including patients, clinicians, health systems, payers, device manufacturers, and regulators. However, traditional methods of evidence generation for device evaluation can be costly, time consuming and have well understood limitations.1–3 Primary among these is the difficulty translating results from pre-market studies of selected patients in selected centers to real-world experience after device approval.
The rapidly developing digital health information infrastructure is increasingly being harnessed to support more reliable, affordable, and timely evidence generation. Digital information collected as part of standard practice (also called real-world data, RWD), however, may not be fit for purpose for use as part of regulatory-decision making.4 However, if clinical registries collect and curate required data, as summarized by the National Registry Taskforce, they can potentially provide cost-effective RWD to support improved device evaluation.5
The objective of this study was to measure value created by using RWD from the Society for Vascular Surgery (SVS) Vascular Quality Initiative (VQI)6 registry in two areas: cost-savings to gather the required clinical data; and ‘time saved’ in conducting regulatory studies. We compared use of the VQI RWD to projected studies that would have been conducted by the manufacturers had the VQI registry not existed (counterfactual studies). We then discuss how this experience using RWD from the VQI registry compares with a previous case study of valued created from using a coordinated registry network (CRN) to evaluate transcatheter valve treatment (TVT) that was able to use claims data to supplement long-term follow-up.7
Methods
This analysis is based on the experience of four vascular device manufacturers (B-D Bard, Lombard, Medtronic, W.L. Gore) that used RWD from the VQI6 registry in six studies (one premarket and five post-approval) conducted to fulfill conditions of approval as requested by the US Food and Drug Administration (FDA). These studies involved aortic stent grafts and peripheral stents and drug coated balloons manufactured by four companies. The mission of the VQI is to improve the quality, safety, effectiveness, and cost of vascular healthcare by collecting, analyzing, and exchanging information.6 Data in the VQI registry are entered voluntarily by participating centers broadly distributed across the USA and comprise academic, teaching affiliated, and community hospitals.8 9 Data are captured in individual procedural registries and include device-specific data that can be used to monitor the performance of devices in real-world use. Accuracy and uniformity of data collected in VQI are assured by error trapping at data entry, help text for each variable, and webinars and face to face meetings to educate data managers.8 Submission of consecutive cases is assured by annual audit of claims data submitted by each center participating in a device evaluation project. Source data are requested and obtained from sites to clarify any outlier or questionable data identified during analysis.10 Outcome results from device evaluation projects using VQI data closely match those reported in the literature, further validating the accuracy of the RWD from this registry.11 Treatment methods reflect real-world decision making and represent standard of care practice across VQI. Allocation of treatment is not influenced by any specific study; rather, data collected as part of routine care are then used for such studies. The VQI currently includes 700 centers with over 3500 participating physicians of different specialties, including vascular surgeons, cardiologists, radiologists, cardiac surgeons, general surgeons, among others.12
The six studies analyzed here involved data from the endovascular abdominal aortic aneurysm repair (EVAR), thoracic endovascular aortic repair and peripheral vascular intervention registries in VQI. Each of these captures detailed information regarding patient demographic, historical and disease severity, procedures including device identifiers, and outcomes up to 1 year after the procedure. For these specific industry device evaluation projects, additional data elements and follow-up data, as established prospectively by the manufacturer, the FDA, and a VQI Steering Committee, were entered by centers that volunteered to participate in these projects. All VQI centers were invited to participate, and a selection of those that volunteered was made by the Steering Committee, to obtain geographic and annual volume balance. Participating centers are reimbursed for additional data entry and follow-up required, and associated costs were included in this analysis. All eligible cases were included from each center as confirmed by an annual VQI audit against claims data submitted by each participating center. All care and follow-up time points were considered standard practice by the Steering Committee for each project. The SVS VQI is organized as a Patient Safety Organization, so all data provided to industry sponsors or the FDA for these projects were fully non-identifiable. Center recruitment, data monitoring, center payments and contracting were performed by M2S, the technology partner for the SVS VQI, and the associated charges to industry were included in this analysis.
The six projects included in this analysis were conducted either to collect data for a post-approval study or to supply comparative data for propensity matching with existing device data to support label expansion. They were initiated between 2014 and 2018 and several remain active since 5-year follow-up is required for many of these projects. Most of the required data elements were collected as normally required for the VQI registry, but supplementary data or follow-up time points were also required for each project as noted above. The total charge to the manufacturers to supply sufficient data for these projects throughout their entire projected duration was included in the actual cost.
In order to compare the actual cost of these six studies using VQI registry data with the estimated (counterfactual) costs that manufacturers would have incurred by performing these studies independently, we used the model described by Wimmer et al.13 Cost drivers in the model to calculate counterfactual costs include: number of patients, number of centers, need for recruitment, need for randomization, need for control group, percentage of centers outside the USA, study duration, number of patient evaluations per year, patient evaluation type (phone/in-person), follow-up imaging/tests required, and organ system. We reduced the duration of the simplified base case to 1 year based on the typical follow-up for these device types. The pre-market and post-market review staff at FDA (expert opinion) provided the design features of the counterfactual studies that would have been anticipated to calculate the costs using the Wimmer et al model. Sensitivity analysis for counterfactual costs was done by increasing the number of patients, centers, or procedures required by 10%.
The difference in cost between the studies performed using RWD from the VQI registry and the counterfactual studies that would otherwise have been conducted was calculated and expressed as the cost saving percentage (CSP) and the return on investment (ROI). CSP is equal to the difference between the cost of the counterfactual studies and the cost of the VQI registry studies (cost savings), divided by the cost of the counterfactuals, multiplied by 100. ROI is equal to the difference between the cost of the counterfactual studies and the cost of the VQI registry studies (cost savings), divided by the cost of the VQI studies, multiplied by 100.
For the two post-approval studies that have completed enrollment, the actual time (months) to complete enrollment of prospective patients using the VQI registry was compared with estimates by the manufacturers made prior to the study onset. For the label expansion project, which supplemented existing VQI registry data with additional data elements required, the total time required to deliver the study data was compared with the minimal time that would have been anticipated for the manufacturer to enroll the patients and obtain needed follow-up. Time saving was calculated as the difference between the actual time for VQI study patient enrollment and the industry estimated time for enrollment in an independent study divided by the estimated time for enrollment in an independent study, expressed as a percentage.
Results
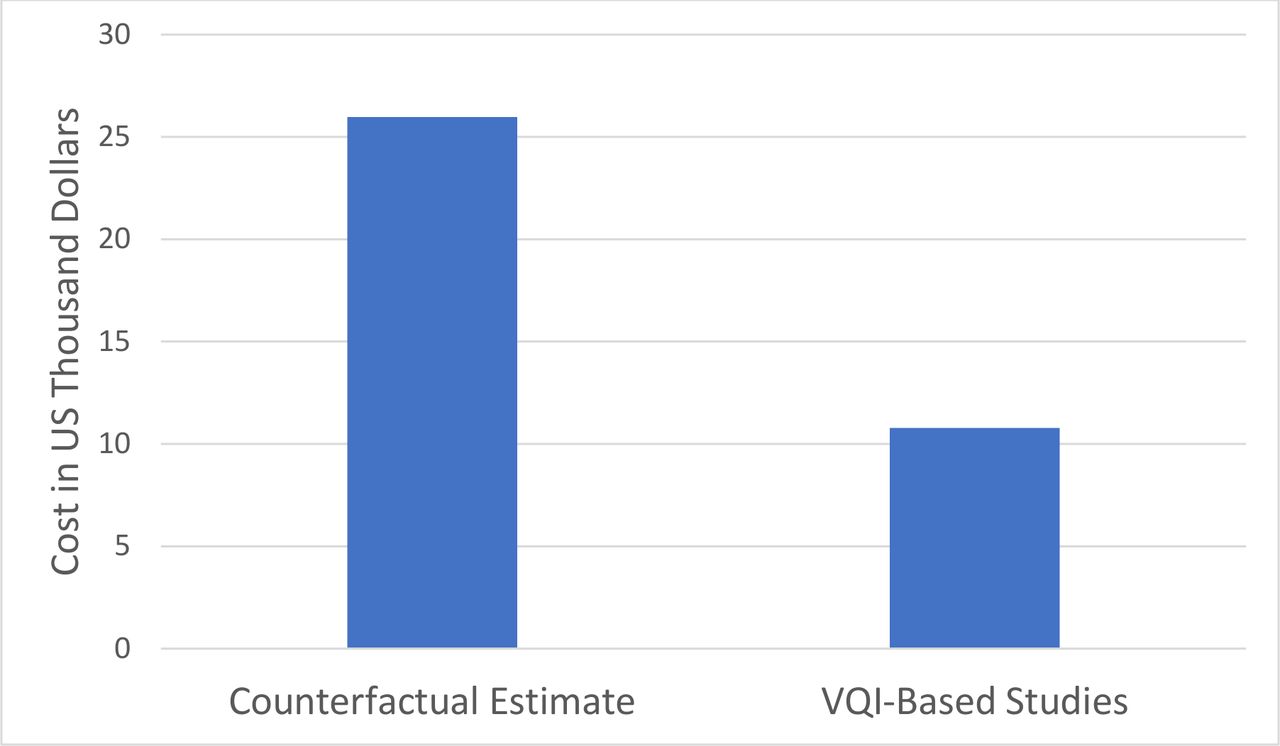
The six studies using VQI registry data varied in terms of the number of patients, centers, follow-up duration, time points and required imaging studies (table 1). On average, 169 (range 74–300) patients were studied at 30 (range 14–38) centers and required 8.7 (range 4–14)) imaging studies during a mean of 4.5 (range 2–5) years of follow-up. The cost of each study to manufacturers varied due to its details (table 1) but averaged US$1.8M (±815K), or US$10 781 per patient studied. In contrast, the average estimated cost of a counterfactual study (table 1) was US$4.4M (±1.7M), or US$26 240 per patient studied. This resulted in a CSP of 59% or an ROI of 143% (figure 1) for use of VQI registry data for these six industry studies. Sensitivity analysis showed that these cost savings persisted across 10% variation in the number of patients, centers, follow-up visits, and imaging studies, the main factors impacting the counterfactual cost estimates (table 2).
Characteristics and costs for six studies conducted using VQI registry data versus counterfactual estimates
Return on investment (ROI) sensitivity analysis: impact of 10% increase or decrease in the number of patients, study centers, in-person evaluations, and imaging evaluations required
Average cost per patient for six studies including 5-year follow-up using real-world data from the VQI registry versus counterfactual estimates of independent industry-sponsored studies. VQI, Vascular Quality Initiative.
For the two fully enrolled post-approval studies using VQI registry data, the time to enroll all patients was 21 months, compared with a prior industry estimate of 38 months if the studies had been done independently, for a 45%-time savings. For the label-expansion study, the time from VQI center invitation to contribute additional required data to data delivery was 5 months, compared with a minimum 17 months that was estimated by the manufacturer if prospective data collection and 1-year follow-up would have been performed in a traditional clinical study, for a 71% time savings.
Discussion
This analysis has demonstrated the potential for substantial cost and time savings when sufficient high-quality registry data are available to support regulatory decisions in lieu of traditional clinical trials. The cost savings to manufacturers who used VQI registry data in these studies was likely due to several factors. First, since many of the required data elements were already entered into the existing registry, payments to centers could be substantially lower than a comparable industry trial that would have required new entry of all data. In some cases, the registry was designed with input from industry and FDA to include all relevant data elements and endpoints.14 Second, the site contracting approval process required for centers in an existing registry is simpler and less costly than an independent project. Third, the infrastructure needed for data monitoring and reporting already exist within the VQI registry, resulting in further cost reduction. While there is an intrinsic cost for maintaining the VQI registry independent of device evaluation studies, this cost is not passed along to device manufacturers.
Time savings described in this analysis is due to leveraging the pre-existing network of VQI centers and physicians who are engaged in this quality improvement process and recognize the importance of evaluating devices with RWD. Recruitment of patients into a registry project depends on real-world practice, including the use rate of the device in practice, which can depend on the novelty and thus market share for the new device. Time saving is more guaranteed and substantial for studies where data, including long-term, already exists within the VQI registry, even if supplementation with some additional retrospective data collection is necessary.
In addition to time and cost, another commonly referenced limitation of traditional clinical trials is the potential difficulty of generalizing the results from select providers and institutions with strict inclusion/exclusion criteria or from a limited number of sites and patients. Data from the VQI studies analyzed in this report were derived from both high and low volume centers broadly distributed geographically across the USA, from various types of hospitals. The data for these studies include all patients meeting inclusion/exclusion criteria, treated per the standard-of-care during this time period, as documented by audit against claims data. This substantially increases the generalizability of conclusions when compared with traditional post-approval studies often conducted in the same high volume, specialized centers that participated in the pre-market approval studies.
A significant portion of the cost for VQI registry studies was due to the need for additional follow-up data collected up to 5 years, which is not standard for the registry, and requires substantial additional work by participating centers. This could be mitigated by incorporating additional data sources, such as claims data or national health service records, to inform long-term outcomes and replace in-person or telephone follow-up, if this method can be shown to be accurate for specific follow-up endpoints. This concept is embedded in the Vascular Implant Surveillance and Interventional Outcomes Network (VISION) CRN which has successfully matched Medicare claims data with patients in the VQI registry to combine the detailed patient and procedural registry data with long-term events such as mortality and reintervention associated with specific procedures and devices.15 Recent VISION publications have demonstrated the accuracy of this method to evaluate EVAR devices and can be extended to other device types.16 Such CRN activity has the potential to substantially reduce the cost of future device evaluation projects that use registry data and require long-term follow-up.
The ROI shown in the current VQI registry studies of 143% was substantial, but not as high as the greater than 550% ROI reported in the TVT studies that combined registry data with Medicare claims data for follow-up.7 The observed difference in ROI is primarily due to the additional savings created by using Medicare claims data for follow-up using the TVT CRN versus face-to-face visits in the VQI registry studies, emphasizing the high cost of 5-year follow-up. Precise attribution of the value created by reuse of the registry platform and reuse of outcomes data cannot be calculated due to the variation in design features of the studies (eg, number of centers, patients, imaging studies, and duration of follow-up). However, it appears that about half of the ROI can be attributed to use of existing registry data and half to the use of claims data to reduce this cost of long-term follow-up. In the TVT studies, the cost saving attributed to the registry platform represented 52%, while the cost saving attributed to follow-up represented 48% of the total cost saving.
The cost of collecting registry data may be decreased further as clinical centers re-engineer care delivery to improve efficacy, quality, and ease in data collection.17 To decrease the burden of data collection on healthcare providers, structured data capture is being promoted, which would allow direct data transfer from electronic medical records to registries. Data collection is then distributed across all members of the healthcare team (including the patient) and integrated into normal workflow.18 19 Structured data capture redefines the roles of data collection, embedding and integrating collection of data as a component of individual healthcare member responsibilities. This re-engineering of clinical workflows to eliminate the need for chart abstraction and secondary data re-entry will greatly improve efficiency and data quality, as data moves directly from sources without manual curation steps, further increasing the value created by the registry.
While the VISION CRN has been able to link Medicare claims and some state claims data, it would greatly benefit from an all-claims linkable data source to capture all patients. If established, such a database could serve as a source of longitudinal follow-up data for a variety of real-world studies. The CRN model for evidence generation for device evaluation has spread rapidly with 15 device areas (a large proportion of implantable devices) currently covered by national registries and with prospects for development into platforms for on-going device development and evaluation.15 CRNs are an example of what economists call ‘strategically coordinated networks’ which are the source of value in the successful economies around the world.20 Government plays a new role in these networks, as a key stakeholder leveraging its investments with others.
Limitations
It is important to note that utilization of registry data can be associated with several limitations compared with dedicated prospective studies that may include, lack of third-party adjudication of events and interpretation of imaging. Further, long-term follow-up may be lower in registry studies compared with traditional studies in which patients have agreed to participate. Traditional study monitoring also typically includes oversight by independent third-party experts for adjudication of adverse events (eg, Clinical Events Committee), interpretation of imaging (eg, core laboratories) which can be critical in evaluating certain outcomes. These factors must be considered in determining whether the benefits of RWD overcome potential limitations for each question related to device evaluation.
The ROI and cost savings calculated in this study may be an underestimate of the ROI due to the assumptions made by the Wimmer et al model which was created to estimate the costs of post approval studies. Among the six VQI studies, one was a label expansion study which are typically more expensive.21 Thus, the Wimmer et al model likely underestimated the value created by using VQI data for one of the six studies included in our aggregate analysis.
Conclusions
Using RWD from an established registry provides considerable benefit by evaluating devices as they are used in practice, which substantially extends knowledge gained from more traditional focused, pre-market evaluations and post-approval studies. Such registry-based studies are associated with a significant reduction in both the cost and time required to perform the study. As CRNs merge claims data with registry data to reduce the cost of long-term follow-up, additional cost savings can be expected, which ultimately reduce the overall cost of healthcare.
Footnotes
Twitter @Artsytwits
Contributors JLC: concept, design, data acquisition, interpretation, draft, revise, approve, accountable. EA-T: design, data acquisition, analysis, interpretation, draft, revise, approve, accountable. AB: concept, interpretation, revise, approve, accountable. DB: concept, interpretation, revise, approve, accountable. JE-J: concept, interpretation, revise, approve, accountable. FR: concept, design, interpretation, revise, approve, accountable. NR: analysis, interpretation, revise, approve, accountable. ASedrakyan: concept, design, interpretation, revise, approve, accountable. ASchick: analysis, interpretation, revise, approve, accountable. JS: concept, interpretation, revise, approve, accountable. RB: concept, interpretation, revise, approve, accountable. PP: concept, interpretation, revise, approve, accountable. MH: concept, interpretation, revise, approve, accountable. SW: concept, design, interpretation, revise, approve, accountable. DM-D: concept, design, interpretation, draft, revise, approve, accountable. GP: concept, design, interpretation, draft, revise, approve, accountable.
Funding The authors have not declared a specific grant for this research from any funding agency in the public, commercial or not-for-profit sectors.
Competing interests None declared.
Patient consent for publication Not required.
Provenance and peer review Not commissioned; externally peer reviewed.
Data availability statement Data sharing not applicable as no datasets generated and/or analyzed for this study. Data may be obtained from a third party and are not publicly available. Data used in this study derived from the Society for Vascular Surgery Patient Safety Organization and the US FDA, and may be requested.